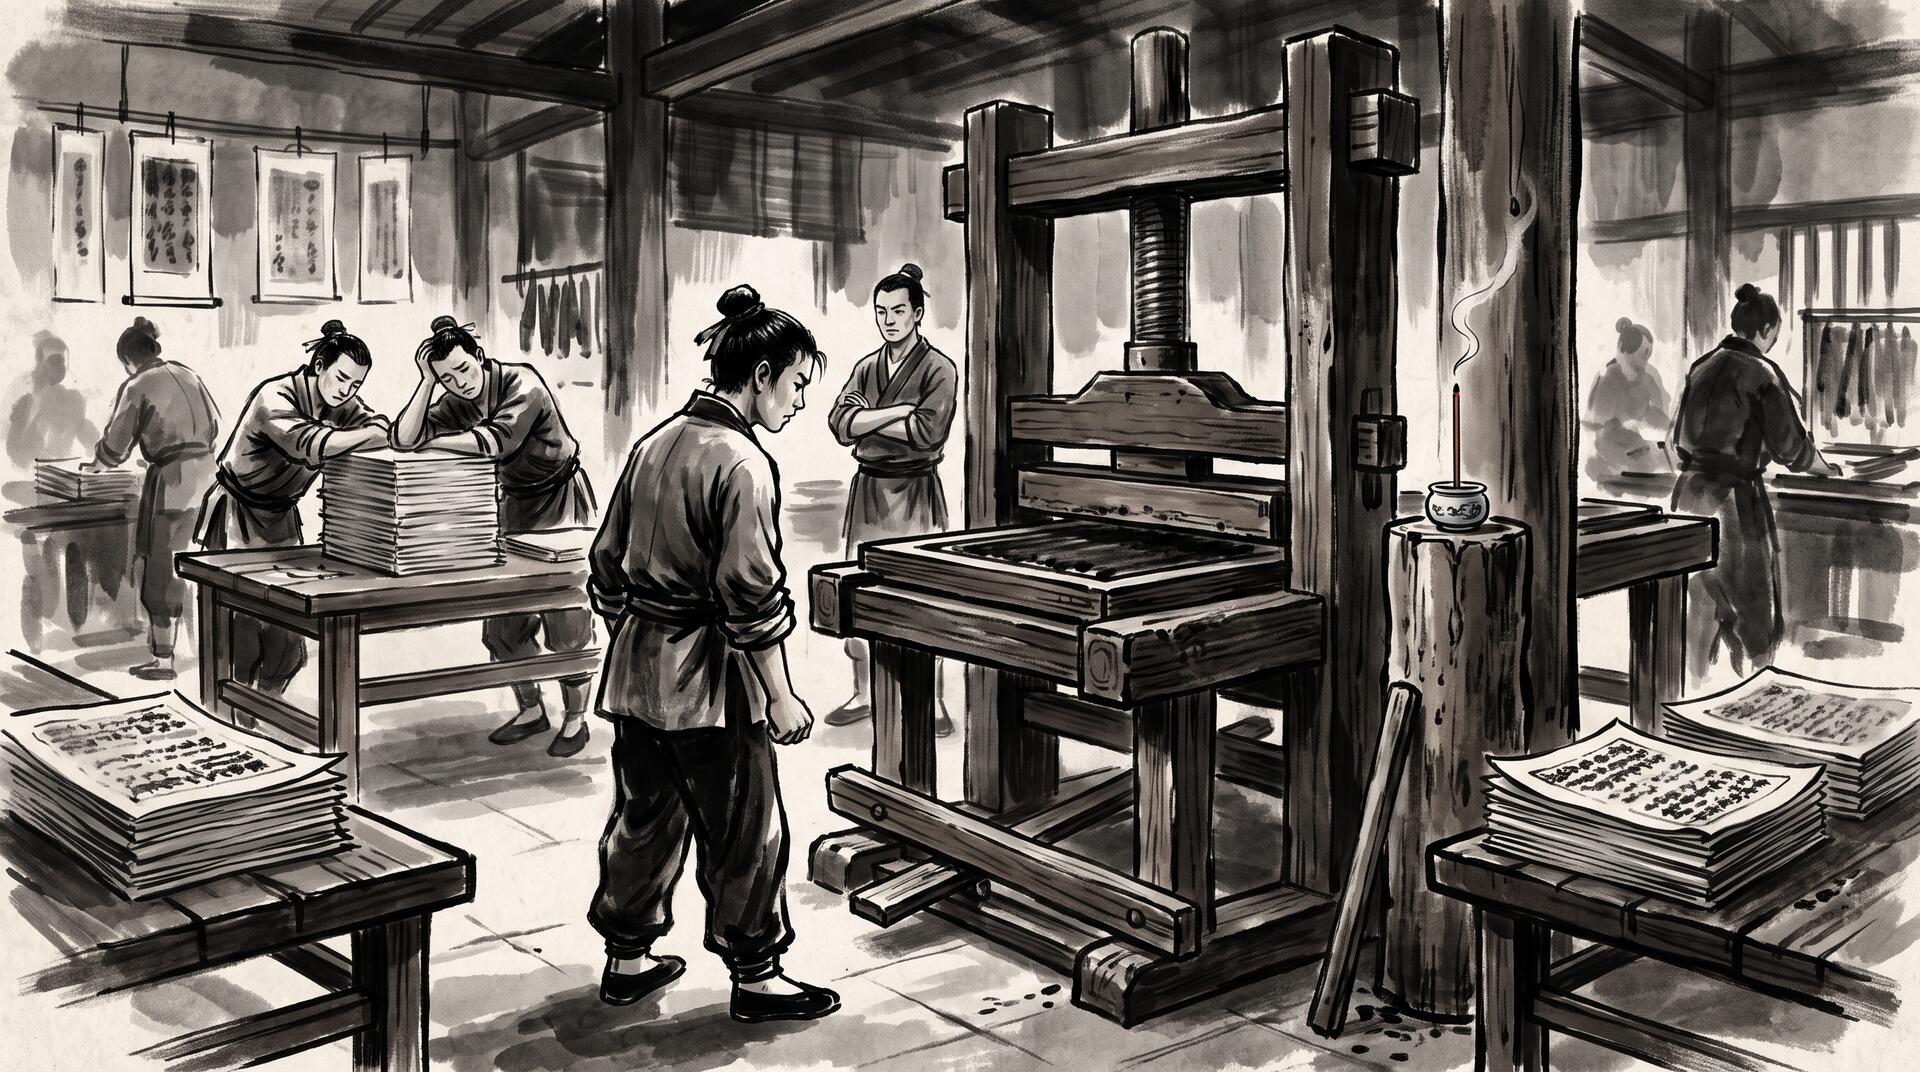
小镇上有一间老字号印坊,坊里养着七八个学徒,却只有一台压印机——那年头造一台不便宜,老板舍不得多添。为了不让谁霸占太久,老板定了个规矩:每一炷香的时间(约一百息),分给每个学徒_固定的一段份额_——比如老三这炉香里能用满二十息,用完这二十息,压印机的踏板就会被锁住,直到下一炷新香点起,才重新解锁。
一开始大家觉得公平。老三手脚慢,常常一炷香过去,二十息都用不完,踏板闲着一半时间。老板看账本也放心:每天傍晚一算,老三这一天总共才用了压印机不到一半的时间,远远没到他该有的份额,理应绰绰有余。
可是有一阵子,坊里活儿紧,老三学会了一个新法子:把要印的东西攒成一叠,一开香就铆足劲猛印,几乎不歇气——往往一炷香刚烧了两成,他那二十息就已经用尽了。踏板”咔”地一锁,任凭他怎么踩,纹丝不动,他只能干站着,等这炷香剩下的八成时间白白流走,直到下一炷香才能再动手。
学徒们都纳闷:账本上明明写着”老三今天总共只用了压印机不到一半的时间”,怎么活儿反倒经常卡壳、越忙越慢?后来老板加了一本新账,专记”这一天老三被锁了多少回、锁了多久”——一翻才发现,老三几乎每炷香都要被锁上七八成的时间,真正在踩踏板的时间零零碎碎,全被切得七零八落。原来”一天总共用了多久”和”有没有被锁着干等”是两本完全不同的账,只看前一本,永远发现不了后一种苦。
老板后来想通了:老三不是懒,也不是活儿少,而是他把活儿都挤在了每炷香最开头那一小段猛干,恰好撞上了”每炷香限二十息”这条线。要么把这份额摊得更松、允许他跨香借用,要么劝他别把活儿都堆在开头,细水长流地印,才不会一次次撞上锁死的踏板。
——到这儿你大概已经认出来了:这台压印机,其实是 Linux 的 cgroup CPU quota 机制,老三反复被锁的踏板,就是容器常见却容易被忽视的 CPU throttling。
概念解释 Kubernetes/OpenShift 里给容器设置 CPU limit 时,底层由 Linux 的 CFS(Completely Fair Scheduler)bandwidth controller 实现:内核给每个 cgroup 一个固定的 period(默认 100ms),以及这个 period 内能用的 quota(比如 limit 是 500m,quota 就是 50ms)。一旦某个容器的线程在 period 刚开始时并发爆发式地把 50ms 全部用光(哪怕是靠多核并行几毫秒内冲完),内核就会把它_挂起_,直到下一个 period 开始才解锁——这就是 throttling。诡异之处在于:container_cpu_usage_seconds_total(平均用量)这类指标看起来完全正常、远低于 limit,因为它把”用了多久”摊到了很长的时间窗口里平均;真正暴露问题的是另一个专门的指标 container_cpu_cfs_throttled_periods_total / throttled_seconds_total。这也是为什么很多 Go/Java 服务在压测或高并发短时爆发时会出现莫名其妙的尾延迟(tail latency)飙升,CPU 使用率图表却”看着很闲”——本质是并发线程数超过了 quota 在短 period 内能撑起的核数。
隐喻对应表
- 老印坊、压印机 → 节点上的 CPU 核心 / cgroup 可用算力
- 一炷香(固定长度) → cfs_period_us(默认 100ms 的调度周期)
- 老三这炉香能用的二十息 → cfs_quota_us(容器 CPU limit 换算出的配额)
- 老三攒活猛印、几口气冲完二十息 → 多线程/多协程并发爆发,在 period 极早期就把 quota 冲光
- 踏板”咔”锁住,剩下的香白白流走 → 进程被 throttled,强制挂起到下个 period
- “一天总共用了多久”那本旧账 → 平均 CPU 使用率指标,掩盖了真实问题
- 新添的”被锁了多少回”账本 → container_cpu_cfs_throttled_periods/seconds_total 这类 throttling 专用指标
- 老板建议”别把活堆在开头,摊开印” → 优化思路:调大 limit、放宽 period,或限制并发度,让负载更平滑
In a small town there was an old-name print shop with seven or eight apprentices, but only one printing press — presses were expensive back then, and the owner wasn’t buying a second. To keep any one apprentice from hogging it, the owner set a rule: every incense-stick’s burn (about a hundred breaths) was divided up, and each apprentice got a fixed slice of it — say, Old San could use the press for twenty breaths out of each stick. Once he’d used his twenty, the pedal locked, and it wouldn’t unlock until the next stick was lit.
At first it seemed fair enough. Old San worked slowly, and often a whole stick burned down without him using all twenty breaths — the pedal sat idle half the time. The owner checked the ledger and felt reassured: tallied up each evening, Old San used the press less than half his allotted time for the whole day, well under his share, plenty to spare.
Then a busy stretch hit the shop, and Old San found a new trick: he’d stack up a pile of work, and the moment a fresh stick was lit, he’d pound away at full speed, barely pausing — often burning through his twenty breaths before the stick was even a fifth gone. The pedal locked with a click. No matter how hard he stomped, it wouldn’t budge. He could only stand there while the remaining four-fifths of the stick burned away uselessly, waiting for the next one to start before he could work again.
The other apprentices were baffled: the ledger plainly showed “Old San used less than half the press-time today” — so why did his work keep stalling, and why did it get worse the busier things got? Eventually the owner started a second ledger, one that tracked only “how many times today was Old San locked out, and for how long.” Flipping through it, he found Old San was locked out for seventy or eighty percent of nearly every single stick — his actual pedaling time was scattered into tiny, broken fragments. It turned out “how much total time was used today” and “how much time was spent locked out waiting” were two completely different books. Reading only the first, you’d never discover the second kind of suffering.
The owner eventually understood: Old San wasn’t lazy, and he didn’t have too little work — he was cramming all his effort into the very start of each stick, and running straight into the “twenty breaths per stick” ceiling. Either loosen the allowance so he could borrow across sticks, or convince him to stop front-loading everything and instead print at a steady trickle, so he’d stop slamming into that locked pedal over and over.
— By now you’ve probably recognized it: that printing press is really Linux’s cgroup CPU quota mechanism, and Old San’s repeatedly locked pedal is the common but often-overlooked phenomenon of CPU throttling in containers.
What it is and why it matters When you set a CPU limit on a container in Kubernetes/OpenShift, it’s enforced under the hood by Linux’s CFS (Completely Fair Scheduler) bandwidth controller: the kernel gives each cgroup a fixed period (default 100ms) and a quota it may use within that period (e.g. a 500m limit becomes a 50ms quota). If a container’s threads burst concurrently right at the start of a period and burn through the full 50ms almost immediately (easy to do across multiple cores in just a few milliseconds), the kernel suspends it until the next period begins — that’s throttling. The strange part: a metric like container_cpu_usage_seconds_total (average usage) looks perfectly healthy, well below the limit, because it smooths “time used” over a much longer window; the problem only shows up in a dedicated metric, container_cpu_cfs_throttled_periods_total / throttled_seconds_total. This is why Go/Java services under bursty concurrency often show baffling tail-latency spikes while their CPU usage graphs “look idle” — the real cause is concurrent thread count outrunning what the quota can sustain within a short period.
Metaphor mapping
- The print shop, the single press → the node’s CPU cores / a cgroup’s available compute
- One incense-stick (fixed length) → cfs_period_us (the default 100ms scheduling period)
- Old San’s twenty breaths per stick → cfs_quota_us (the quota derived from the container’s CPU limit)
- Old San stacking work and pounding it out in one burst → concurrent threads/goroutines bursting and exhausting the quota very early in the period
- The pedal locking with a click, the rest of the stick wasted → the process getting throttled, forcibly suspended until the next period
- The old ledger of “total time used today” → the average CPU usage metric, which hides the real problem
- The new ledger of “how many times locked out” → dedicated throttling metrics like container_cpu_cfs_throttled_periods/seconds_total
- The owner’s advice to “spread the work instead of front-loading it” → the fix: raise the limit, loosen the period, or cap concurrency so load smooths out