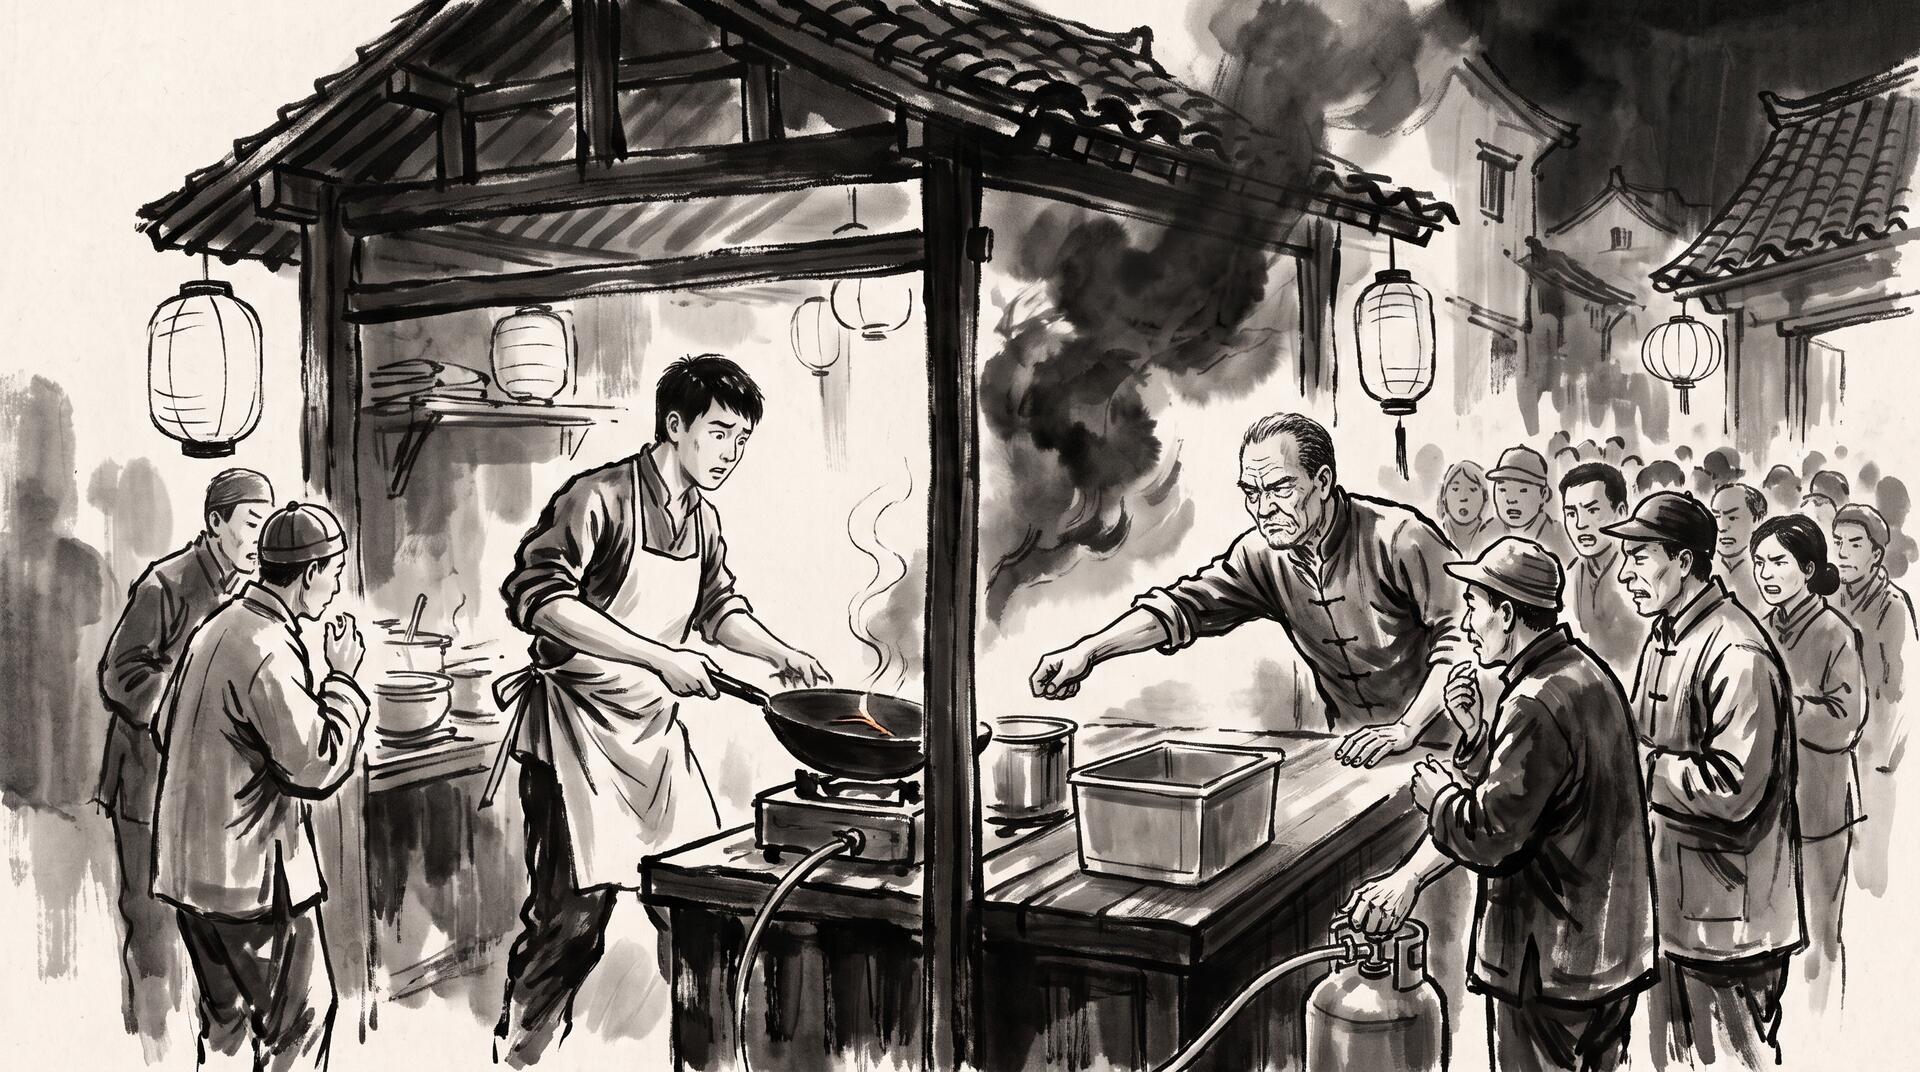
老周在巷子口开了家炒粉摊,生意好起来后雇了个厨子小陈掌勺。可老周信不过年轻人手脚,怕他把一整天的煤气都烧光,便定了个规矩:把一天切成一炷香一炷香的小段(每炷香约烧完需五分钟),每一炷香里,小陈只能用灶台”四分之一”的时间明火炒菜,剩下四分之三时间灶台必须闭着——哪怕锅里还有没炒熟的菜,哪怕外面排队的人越等越急。
平常日子,订单稀稀拉拉,小陈一炷香里可能只用了十分之一的时间就把菜都炒完了,灶台一整天看着都挺闲的。可一到饭点,单子哗啦啦涌进来,小陈手脚再快,在这炷香刚烧到三分之一的时候,配额就用光了——灶眼”啪”地被摁灭,任凭锅里的菜半生不熟,他也只能干等,等下一炷香点上才能继续。
最要命的是,老周在账房里翻着流水账,看到的是”小陈平均每天只用了两成火力”,于是断定灶台绰绰有余,从不多想。可饭点排队的客人只在意菜什么时候端上来——他们等的那几分钟”卡顿”,账本上一个字都不会写。老周百思不得其解:明明账上写着灶台很闲,为什么饭点总有人抱怨等菜等到怀疑人生?直到有天他蹲在灶台边掐着表数了数,才发现问题根本不在”总共烧了多少”,而在于”每一炷香烧到几分之几就被摁灭”。
——到这儿你大概已经认出来了:这讲的其实是 cgroup CPU throttling——容器在 Kubernetes / OpenShift 里设了 CPU limit 之后,内核用 CFS(Completely Fair Scheduler) 把每个 period(默认 100ms)分成若干时间片,容器在这个 period 里能用的 CPU 时间由 quota 决定。哪怕这个容器全天的_平均_ CPU 使用率远低于 limit,只要它在某个 100ms 的 period 里突发性地把 quota 用尽,内核就会把它挂起(throttled),直到下一个 period 才能继续跑——于是 P99 延迟尖刺,而监控面板上的 average CPU usage 却显示”一切正常”,这正是这个坑最容易被误诊的地方:看 average 看不出 throttling,得去看 container_cpu_cfs_throttled_periods_total 这类指标才能抓到真凶。
隐喻对应表
- 老周定的”一炷香只能烧四分之一”规矩 → CPU limit 换算出的 quota(每个 period 允许用的 CPU 时间)
- 一炷香烧完的时间(五分钟一段) → CFS period(默认 100ms)
- 小陈被摁灭灶眼、干等下一炷香 → 容器被 throttled,挂起等待下一个 period
- 老周账本上”平均只用两成火力” → 监控面板上的 average CPU usage(看似正常,掩盖真相)
- 饭点排队客人等菜的那几分钟卡顿 → 请求的 P99 latency spike
- 老周蹲在灶台边掐表数的动作 → 排查时改看
cfs_throttled_periods而非 average 指标
Old Zhou ran a noodle stall at the end of the alley. Once business picked up, he hired a young cook, Chen, to man the wok. But Zhou didn’t quite trust the kid’s pace — afraid he’d burn through a whole day’s gas in a rush — so he set a rule: the day was carved into little segments, each the length of one burning incense stick (about five minutes). Within each stick, Chen was allowed to keep the flame roaring for only a quarter of that time. The other three-quarters, the burner had to stay dark — no matter what was still sizzling half-cooked in the pan, no matter how long the line outside grew.
On slow days this was no problem. Orders trickled in, and Chen often finished everything using just a tenth of his allotted stick — the stove looked idle nearly all day. But at the lunch rush, orders poured in all at once. However fast Chen’s hands moved, by the time the stick had burned through a third of its length, his quota for that stick was gone. The burner was snuffed out on the spot — pan still half-raw — and Chen could only stand there and wait for the next stick to be lit before he could resume.
Here’s the maddening part: when Old Zhou checked his ledger, all he saw was “Chen uses the flame only 20% of the time on average” — so he concluded the stove had plenty of room to spare and never thought twice. But the customers queued at lunch didn’t care about the daily average; they cared about the few minutes their dish sat stalled mid-cook, and that stall never showed up as a single line in the ledger. Old Zhou was baffled — the books said the stove was practically idle, so why did people keep grumbling about waiting forever at lunch? It wasn’t until he crouched by the stove with a stopwatch, counting things out stick by stick, that he realized the problem was never about the total burned all day — it was about exactly what fraction of each individual stick got used before the flame was snuffed.
By now you’ve probably recognized it — this is really about cgroup CPU throttling. When a container in Kubernetes/OpenShift has a CPU limit set, the kernel’s CFS (Completely Fair Scheduler) slices time into periods (100ms by default), and how much CPU time the container may use within each period is governed by its quota. Even if the container’s average CPU usage across the whole day sits well below the limit, the moment it bursts and exhausts its quota within a single 100ms period, the kernel suspends it (throttled) until the next period begins — producing sharp P99 latency spikes, while the dashboard’s average CPU usage graph keeps insisting everything is fine. That’s exactly why this failure mode is so easy to misdiagnose: averages hide throttling completely. You have to look at metrics like container_cpu_cfs_throttled_periods_total to catch the real culprit.
Metaphor mapping
- Old Zhou’s “only a quarter of each stick” rule → the CPU quota derived from the limit (how much CPU time is allowed per period)
- The length of one incense stick (five minutes) → the CFS period (100ms by default)
- Chen’s burner being snuffed out, forced to wait for the next stick → the container getting throttled, suspended until the next period
- Old Zhou’s ledger showing “only 20% average usage” → the dashboard’s average CPU usage metric (looks healthy, hides the truth)
- The lunch-rush customers’ few minutes of stalled waiting → the request’s P99 latency spike
- Old Zhou crouching by the stove with a stopwatch → switching your investigation from average metrics to
cfs_throttled_periods